
Dear Friends from quite long time I was wishing to write few blogs on this topic, but due to some limitation I was unable to do so. I will be posting few blogs in this series using which any beginners can practice and have hands on to understand this concept and start using this powerful tool for visuals and reporting.
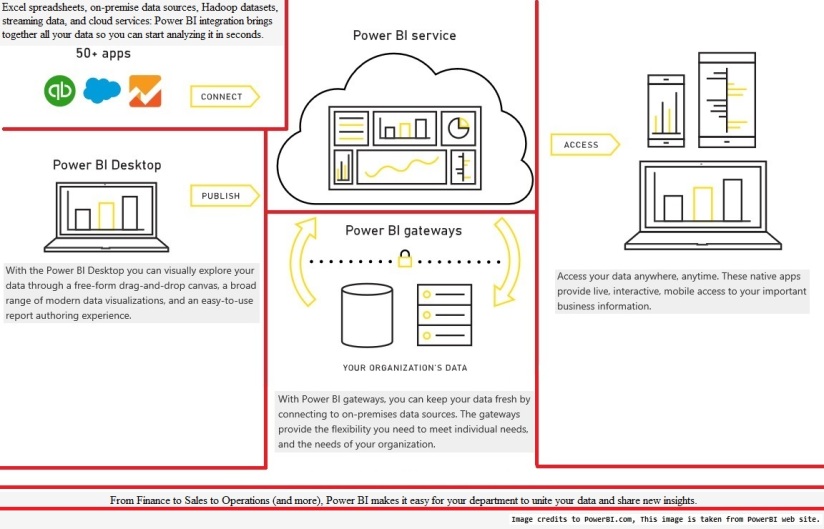
Microsoft Power BI brings your data to life, transforming your company’s data into rich visuals for you to collect and organize so you can focus on what matters to you.
An Overview:
What all you need to get started with creating reports.
To get started first of all we will be required to register our account to PowerBI.com
Go to this Link Power BI
Scroll down on page to find below
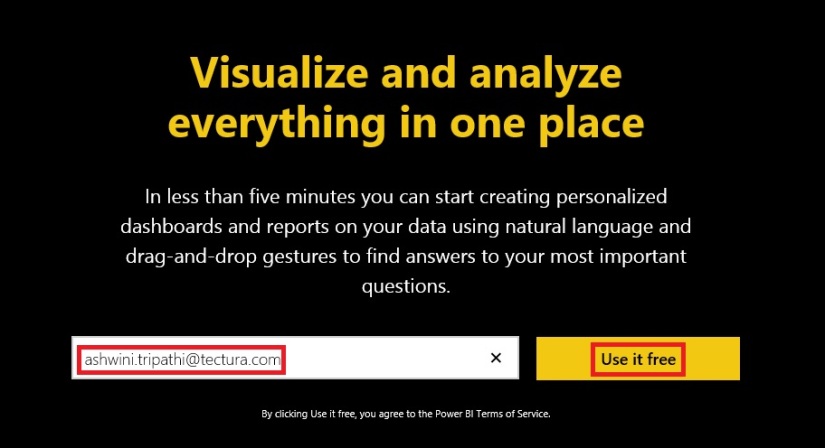
Here you require your company registered e-mail id, any private e-mail id for example Yahoo, Google, Hotmail etc. will not be acceptable.
Follow the onscreen guide to complete your signup.
Please use this link to access available downloads.
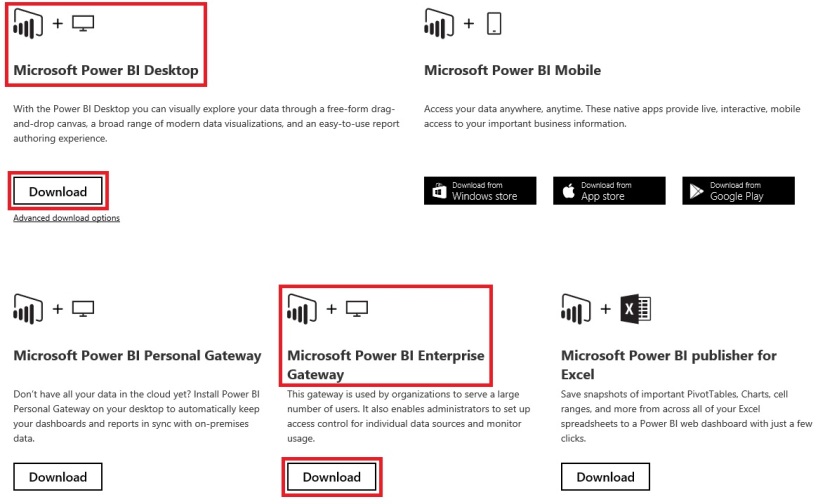
As of now we will use highlighted two components. Download and Install them. We will use and explore them in our upcoming posts.
At this step you are ready to start with using Power BI, you can design the Reports & Datasets on your in premise database and publish to Power BI.
We will use these components in our future posts, today we will have a quick report creation using data from Excel as our first Report. Here we go…….
Step 1- Collecting the Data.
Open your Navision and Export some data which we can use to create our first Report.
In my example I am going to Export my Customer List and save the Excel file, make sure your data is saved in Table Format else Power BI will fail to import data.
Step 2- Getting Data in Power BI from Excel using Get Data.
Login to Power BI using your credentials used above to register the Power BI.
From Lading Page perform below step:
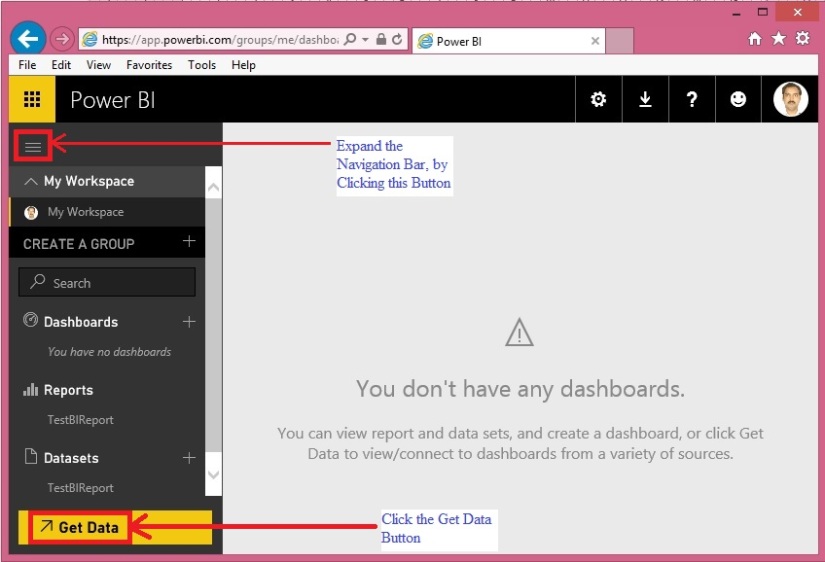
When you click to Get Data you will get options to connect with available data source options.
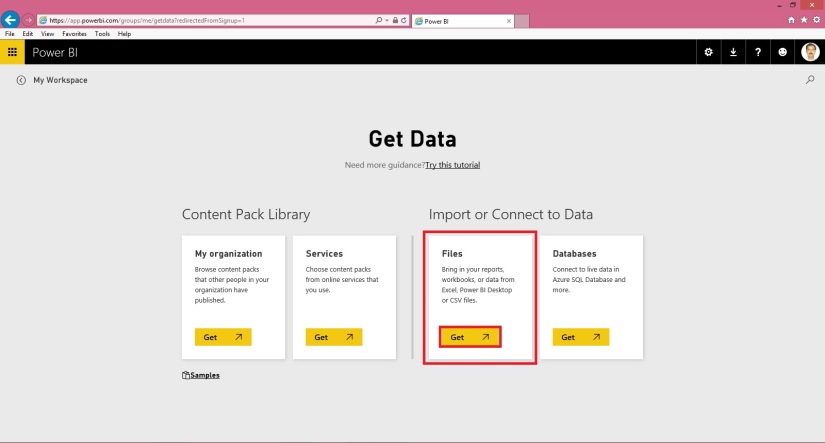
Click Get button as highlighted in above screen shot, as we are connecting the data from Excel file created in above Step.
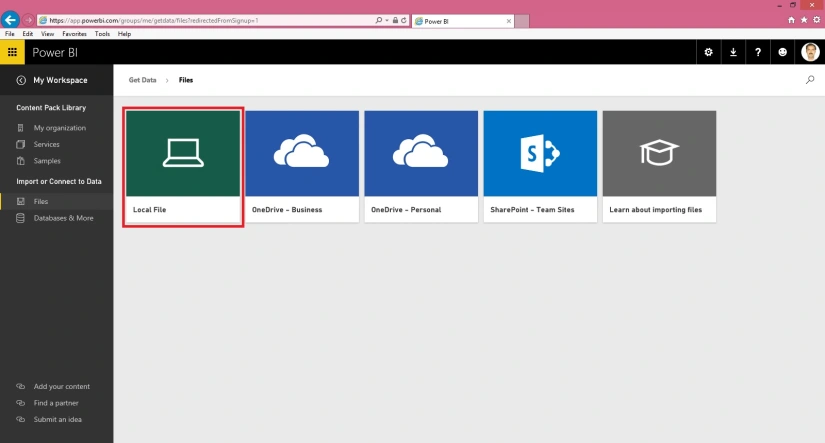
On Clicking Get Button option available to get file will be displayed, depending upon where you placed your file select the desired option. In my case I have saved the File on My Desktop, so I will be using Local File option.
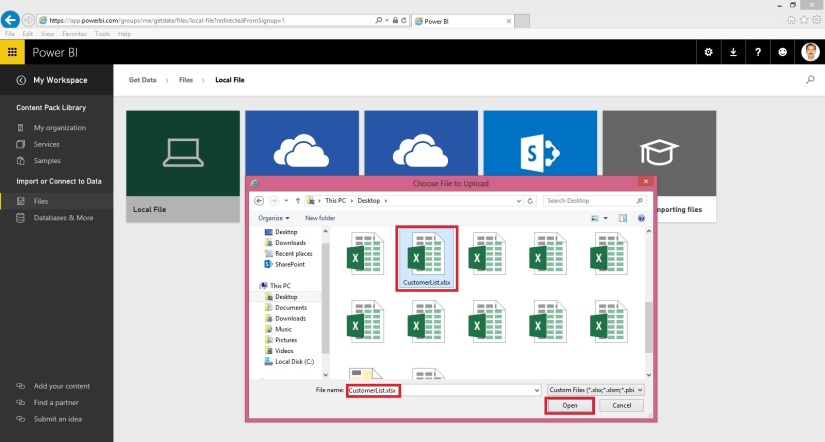
Select the desired file having data. In my case Customer List as created in above step.
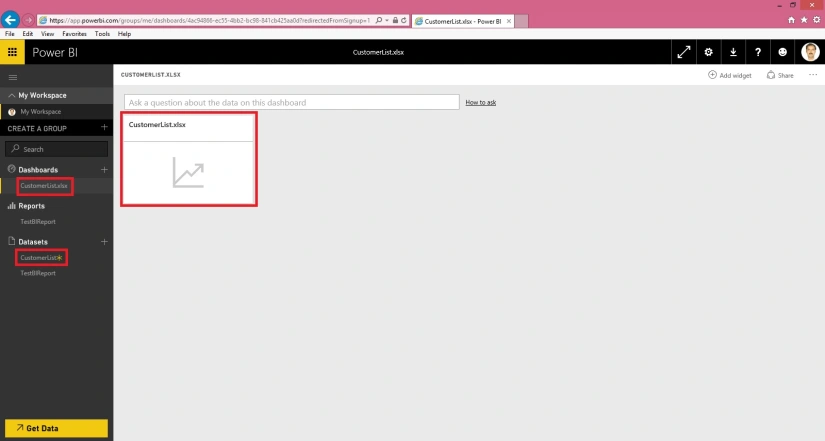
Once done you will see a new Dataset and a Blank Report in Dashboard is added, in my case CustomerList.
Step 3- Analysing Data in Power BI or creating a Visual Report.
Click on the CustomerList dataset
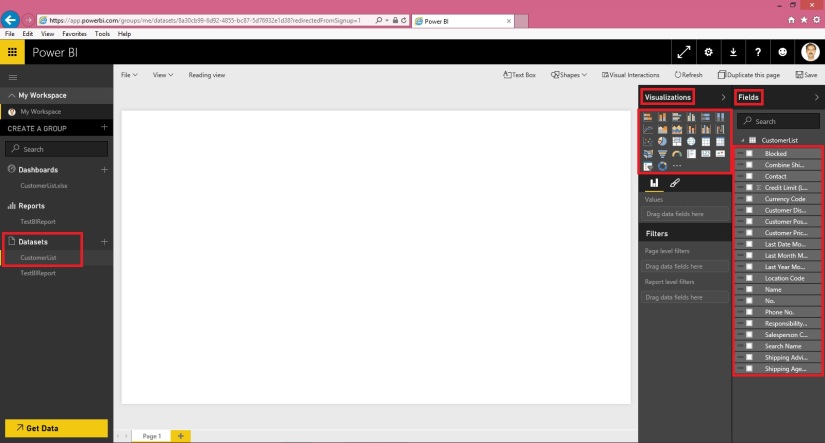
This will show you the available Fields as per Excel columns, an available Visualization options.
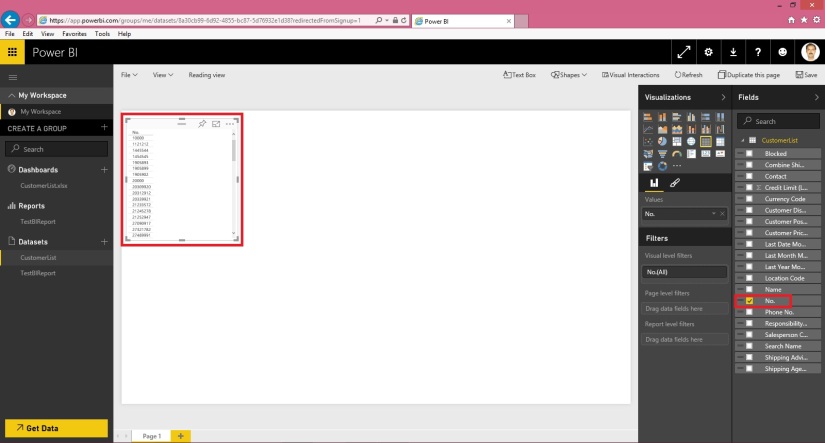
Select the No. Field from the Field List, a list table will be added on the canvas as shown in above screen.
Here say we want to count the no of Unique Customers in the data.
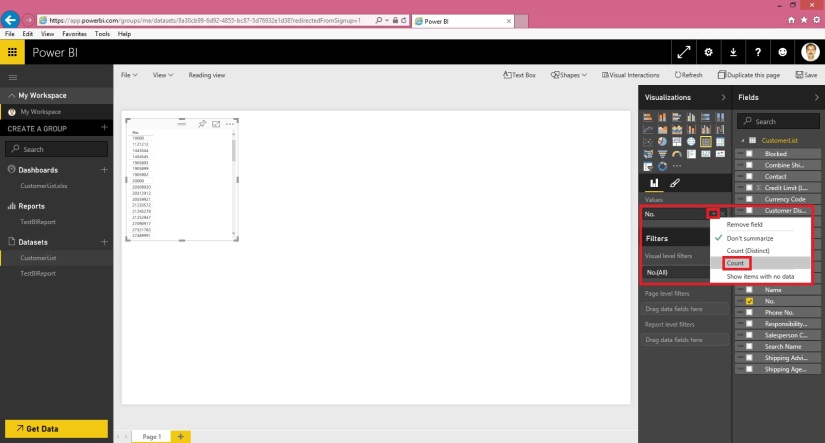
From the Values of the Field we will choose Count Option.
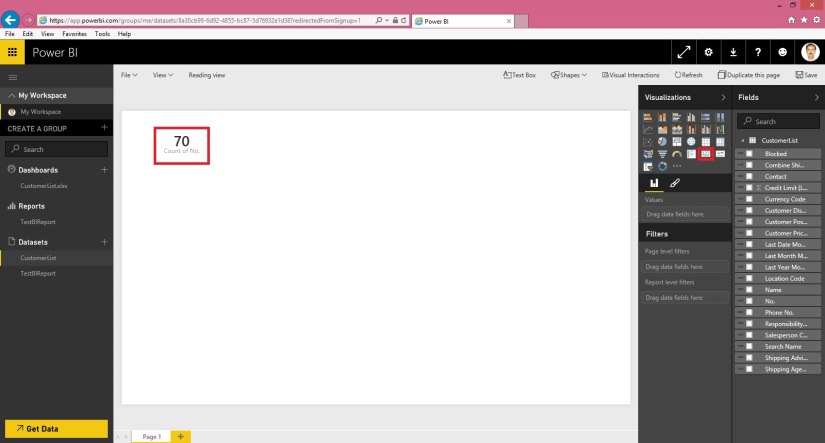
At the same time to make data more representable we will choose Card Visualization.
The data will be formatted and displayed as:
Next we will add sum summary analysis Data.
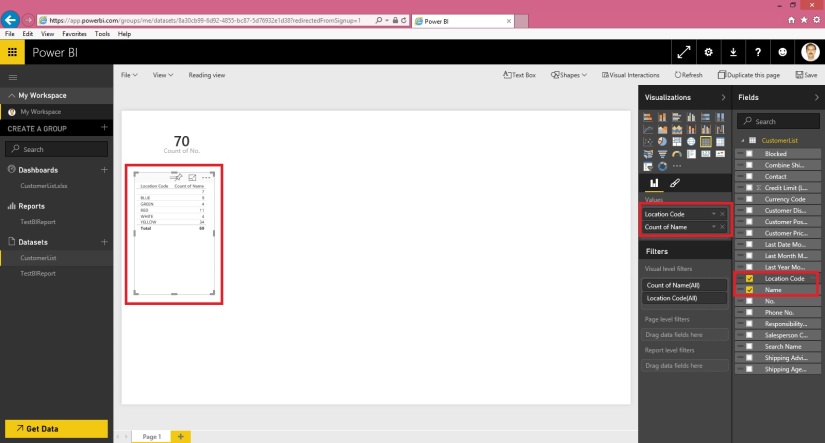
Here we added two Fields Location (Value = Don’t Summarize) and Name (Value = Count). Visualization = Table.
A new table gets added on the Report Canvas as shown above.
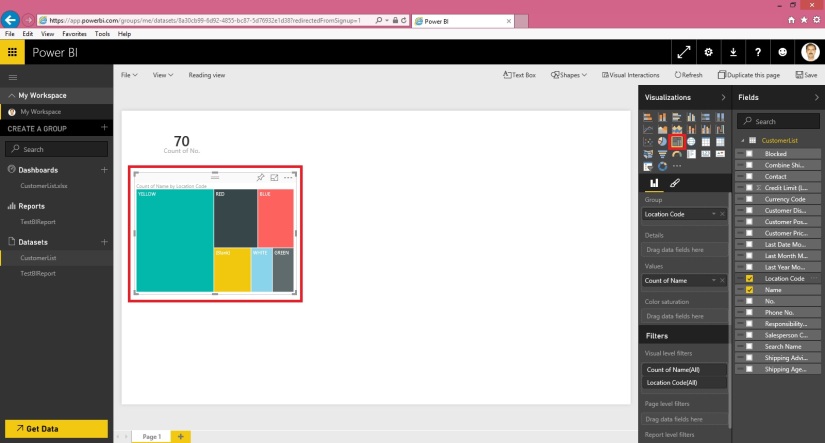
Let’s change the Visualization of above Table to Treemap, the Table will get formatted as:
That’s all for today, we will see more features and other available options in our next blog.
Till then practice and read available blog, documentations and help available online.

14 thoughts on “Microsoft Power BI – Part – I”
Comments are closed.